
In this article I’m going to take you through my TRACES data method. TRACES will show you the critical metrics you need to watch on your website in order to grow.
If you aren’t watching these metrics you simply don’t understand what is going on in your business.
Watch these metrics constantly and you’ll quickly workout how to grow your business MUCH faster.
Alright, let’s get into it…
Table of Contents
Watch the video!
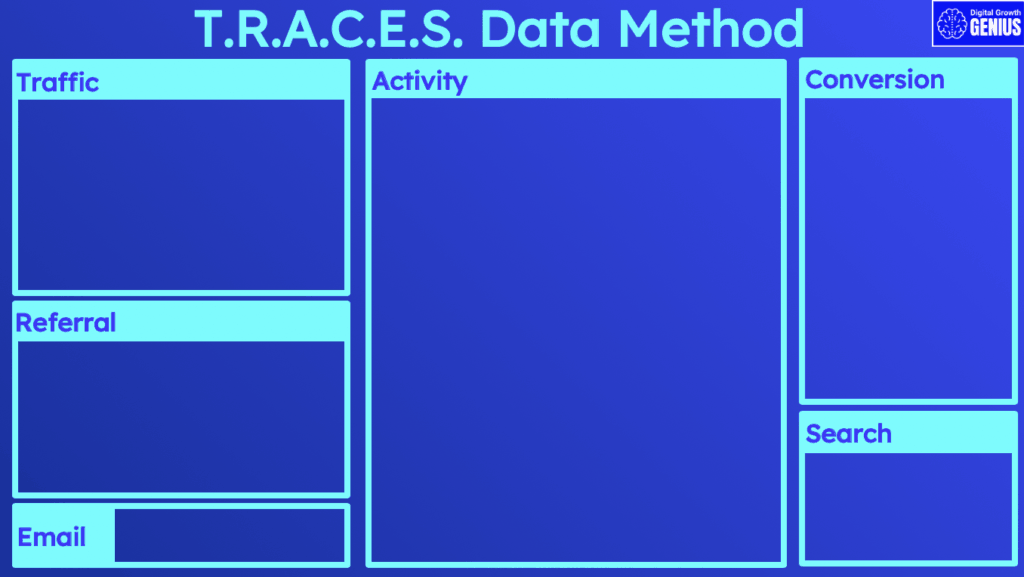
T.R.A.C.E.S Data method
As I walk you through the TRACES data method you’ll hear me refer often to 3 critical tools – Google Analytics, Google Search Console and Google Tag Manager. The good news is that these three awesome tools are free from Google. Check the links below for some information on how to install these tools or get some help from me.
Now, my TRACES Data method stands for:
T for Traffic to your website
R is for referrals in other words, where did this traffic come from
A is for activity – what your website visitors did while on your website.
C is for the all important CONVERSION into email leads or sales
E is for email metrics
And S for Search metrics.
For each of these steps I’m going to make sure you understand the key concepts behind them. Once you understand the concept you’ll be dangerous.
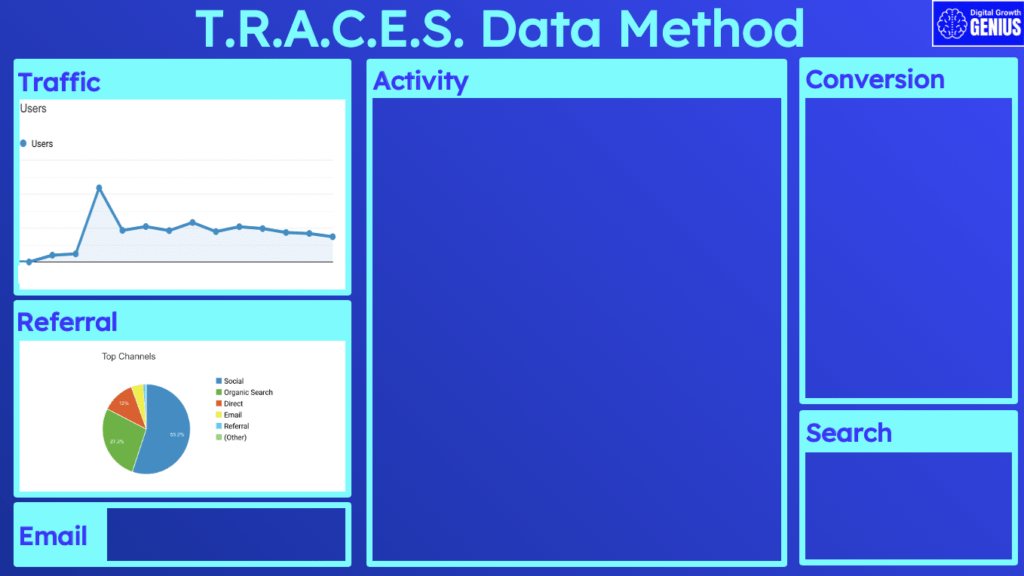
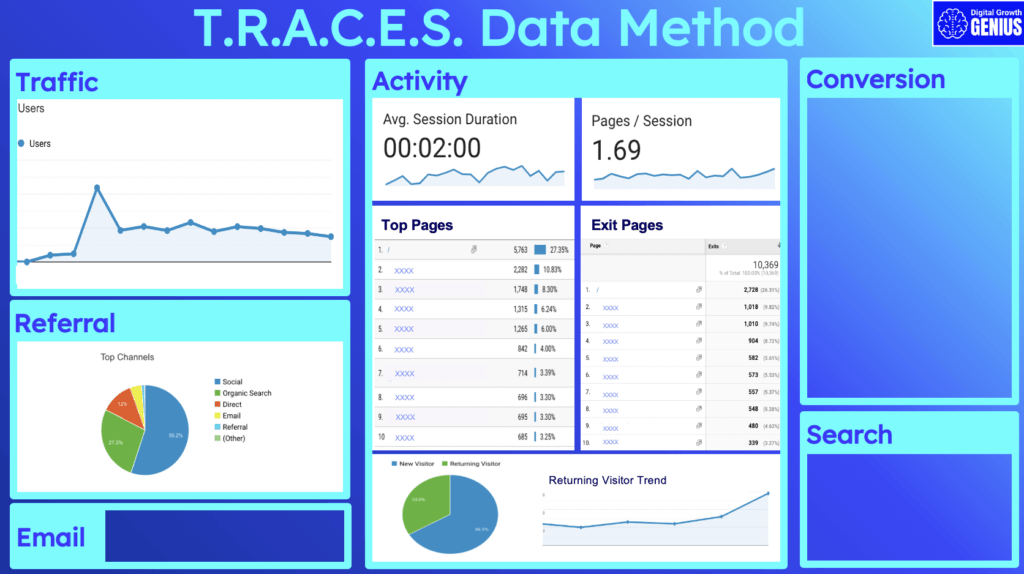
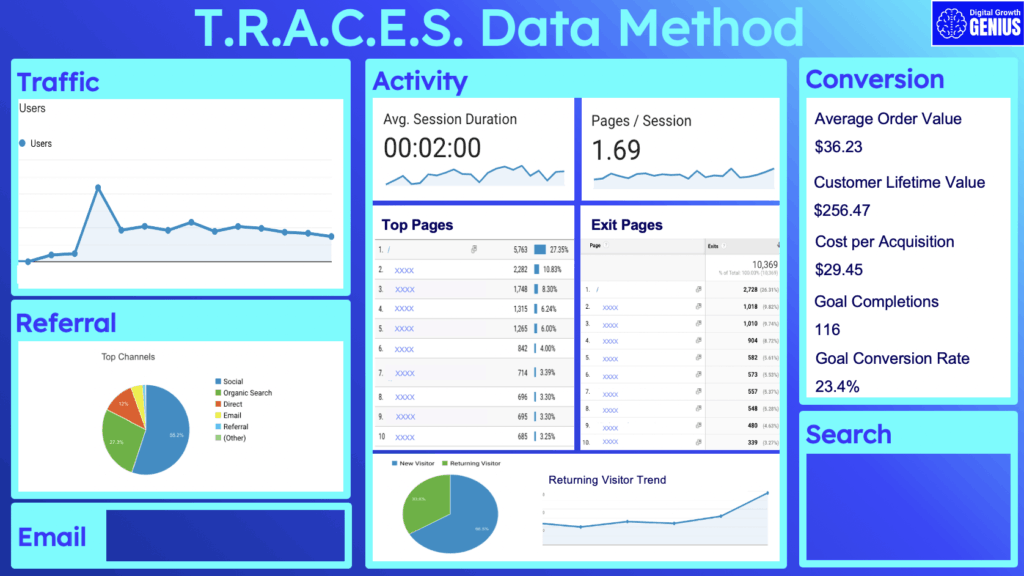
As we go through my data method we’ll build a sample dashboard that you’ll be able to download and copy for your business.
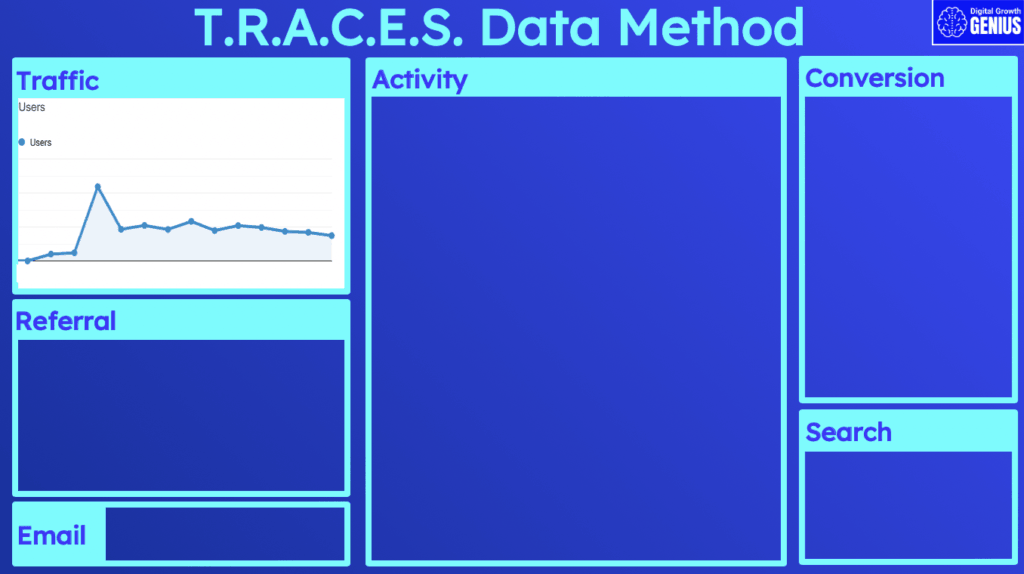
T = Traffic
Let’s start with T for Traffic. When we say traffic we are talking about the number of people that visit your website.
We start with Traffic because it is such an important metric. Pretty hard to get leads and sales without traffic.
If you go into Google Analytics and hit the Audience and then overview tabs you’ll see a summary of traffic to your website over your selected period of time.
Now there are two concepts that are important to understand – “Users” and “Sessions”.
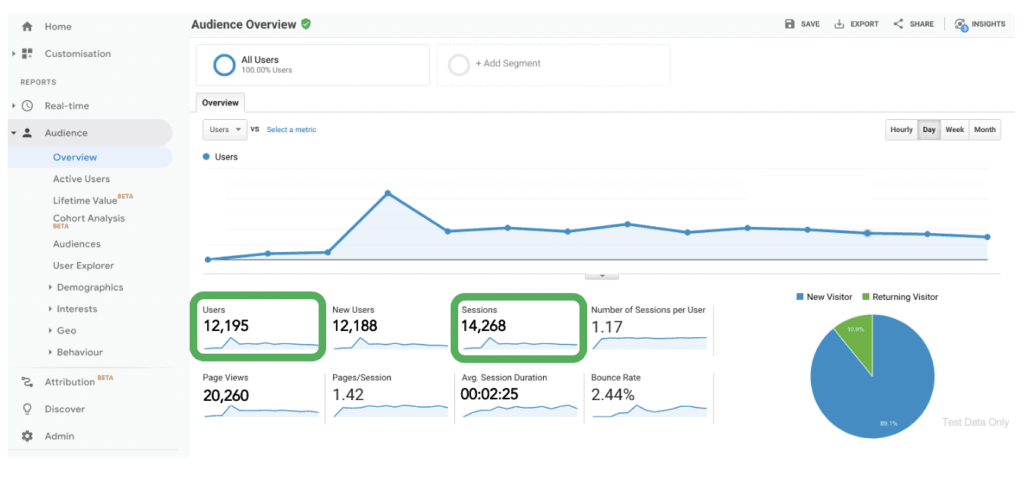
Users are the number of unique people visiting your website while sessions counts the number of times a user came to your website. So if a user came to your website twice over a month that would be 1 unique user and 2 sessions.
For now let’s focus on users as this is a key indication of the traffic to your website.
When it comes to looking at users I focus on three things:
Firstly, Total number of users. Obviously the volume of visitors is important.
Secondly, Are the number of users going up or down – trend is your friend.
Thirdly, Were there any spikes or dips?
Ok, so now you understand the traffic to your website and you’ve noted any trends that might be happening.
Now we need to dig deeper to understand WHY these changes occurred.
R = Referral
We will start this investigation in our next step which is R for Referrals.
In this step we will look at the sources of traffic to help explain any spikes, dips or trends.
If you go back to Google Analytics and hit Acquisition and then overview you’ll see the source of traffic to your website by channel.
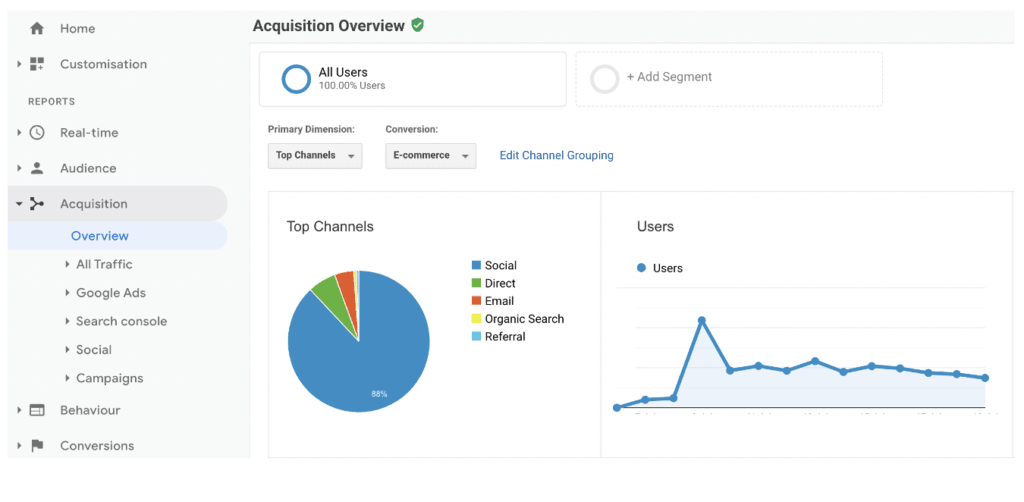
The example I have is for a brand new website we launched for a client. It shows a big spike in traffic after a very successful Facebook launch and you can see this traffic in the social category.
Email was also part of the campaign but we expect that to build over time.
You’ll also see that organic search is pretty small reflecting the fact that this is a brand new website. However, after a few months organic search becomes one of the key drivers of traffic to this website.
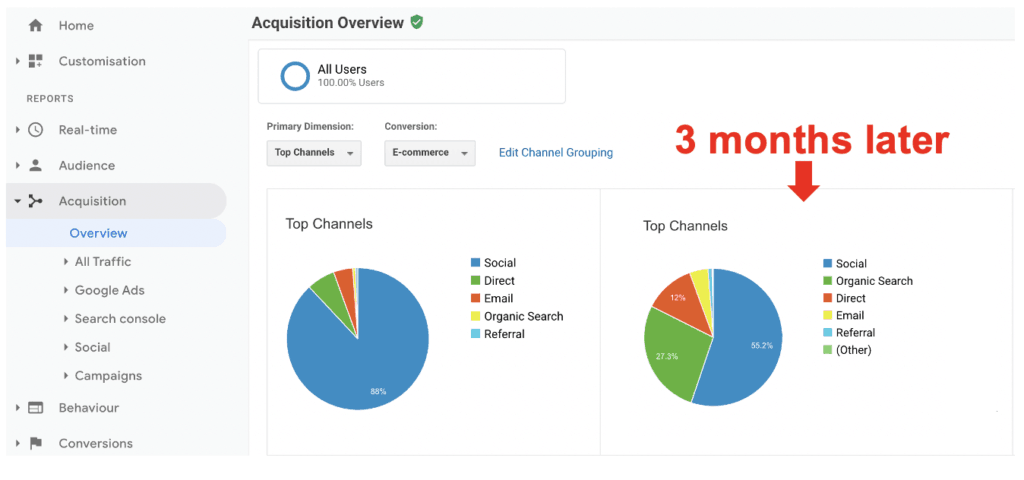
So social is going really well for this website, organic is building very nicely and email is becoming more prominent with lots more opportunity as the database builds.
With this data we can see where we are winning with traffic and where we need to continue to build and focus our efforts.
Importantly, make sure you build a diversified source of traffic. Being reliant on just one source of traffic can expose you to a problem if that source of traffic dries up.
A = Activity
Now we have an understanding of where our traffic is coming from lets
continue our analysis by moving onto A which stands for ACTIVITY.
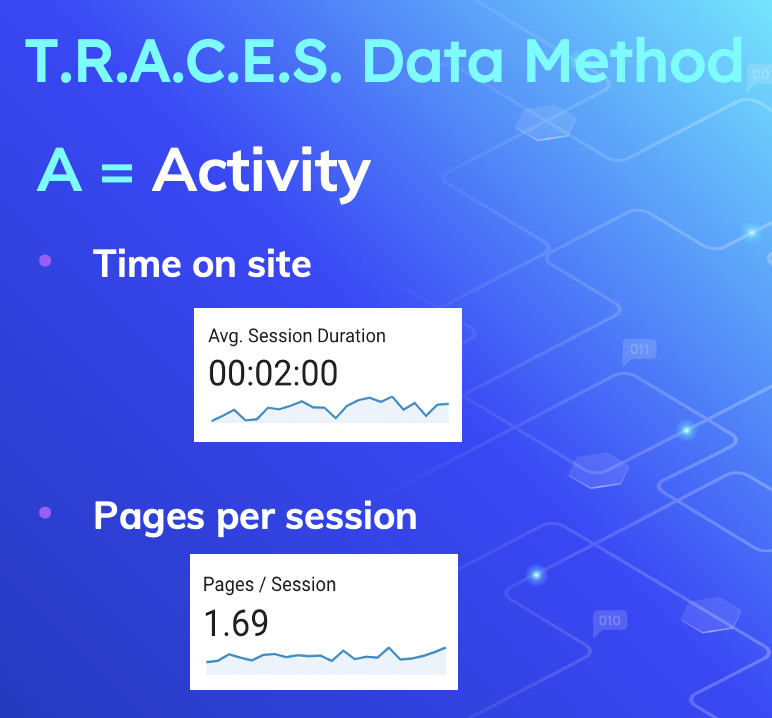
In the Activity step we are looking at what your visitors are doing on your website.
Here are the key metrics in Google Analytics to look at:
Firstly, we want to understand how long they spend on your site – the longer the better and this metric is a good indication of the quality of your website.
The number of pages visited per session. Another good indicator of whether people are looking around the rest of your website.
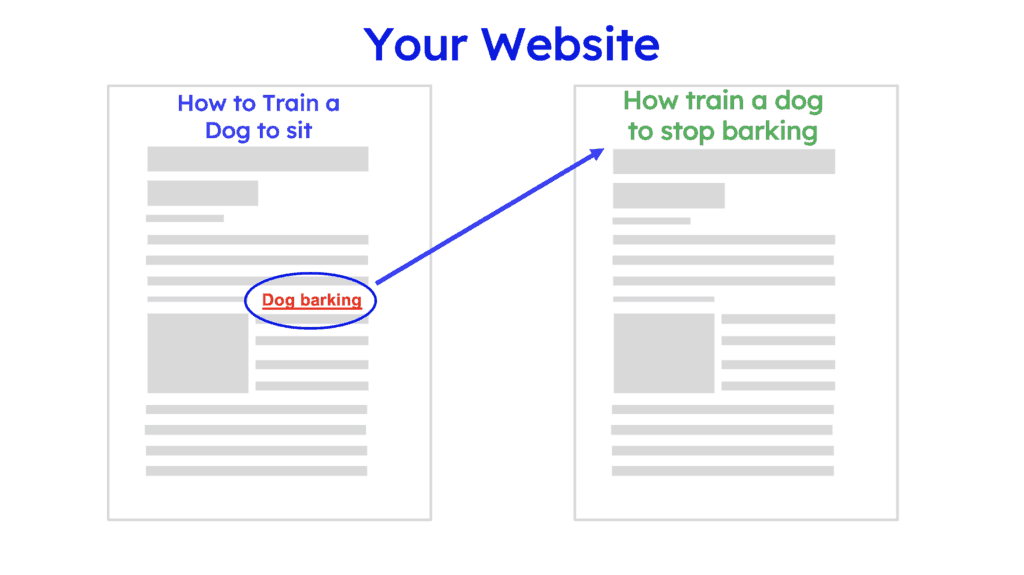
Now an important tip to boost these first two metrics is to make sure you link pages together that make sense. If you have a page on how to train a dog to sit there is every chance that a website visitor might be interested in your article on how to train a dog to stop barking. Find a way to link from one article to the other and you’ll be encouraging people to spend longer on your website.
The next metric is top pages visited. It’s really important you understand which pages are popular. Combine this metric with a list of top pages that people enter your website and you can quickly form a view of the flow of traffic on your website.
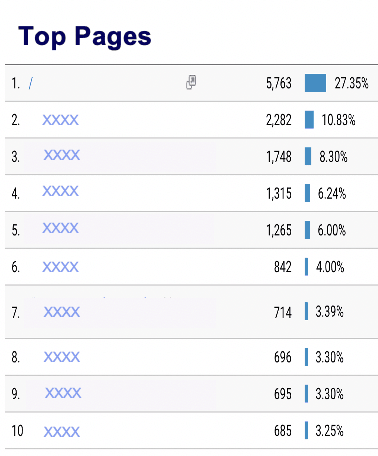
An important tip here is if you have a page that is popular or one of your top entrance pages, make sure you have really worked out how to convert visitors from these pages into an email subscriber or purchaser and of course make sure you are linking to other pages on your website. You want to make sure you are doing everything to capture this traffic and get them to stay longer on your website.
Next is exit pages. Review the top pages that people LEAVE your website from. This is a really important list. Review each of these pages and think of ways to stop people leaving. Could you use page linking again or some sort of special offer to encourage the website visitor to stay longer?
Finally, look at your returning visitor percentage. All businesses want to acquire new website visitors but really good businesses know it’s just as important to retain your existing customers. Check your returning visitor percentage and assess whether it could be better. There is no hard and fast rule here for percentage returning customers but ideally you want the volume of returning visitors increasing over time.
So that completes the Activity part of our TRACES dashboard.
C = Conversion
The next step is C for Conversion.
Conversion is one of my favourite topics and one that is neglected by many businesses. As I just discussed it’s all well and good to want more new website visitors but it’s all a waste if you do a poor job converting those website visitors into customers.
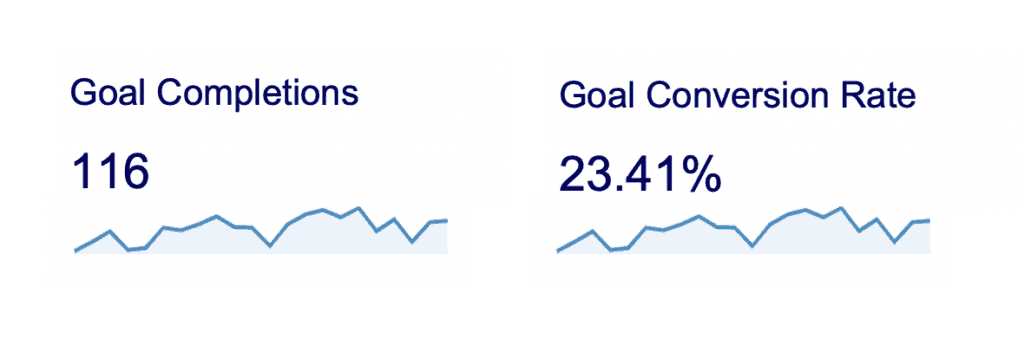
To help you measure conversions you can set up GOALS in Google analytics like website subscribers or cart completions.
Once you have these goals setup you can monitor the conversion of those goals.
Make sure you are monitoring the number of goal completions AND the percentage conversion.
My strongest recommendation here is to test different versions of a page for conversions. You can test different language, emotional or rational features or even prices. If you have a strong testing mindset you will eventually find the secret sauce for your customers and your sales will sky rocket.
Now there are three other conversion metrics that are near and dear to my heart.
The first is average order value or AOV. You need to watch this closely and ensure you are doing everything possible to grow your Average Order Value. My go to strategy to increase the Average Order Value is what I call the “would you like fries with that”. As you can imagine, here you offer someone who is going through checkout an additional product or service. If you make sure this additional product or service helps the customer use the first product faster or easier you’ll be pleasantly surprised how you can improve your AOV. I’ve see this strategy improve the Average order value by over 10% so it works.
The next conversion metric is Customer Lifetime Value.
Customer Lifetime Value is the profit you generate from your average customer for the entire time you have a relationship with that customer. I’ve got an article that explains customer lifetime value more deeply but it’s one of the most important metrics in your business as once you know this you are dangerous.
As an example, customer lifetime value and the final conversion metric, cost per customer acquisition are a powerful combination. If your Customer Lifetime Value is $1,000 AND your cost per acquisition is less than that you know you are going to be profitable.
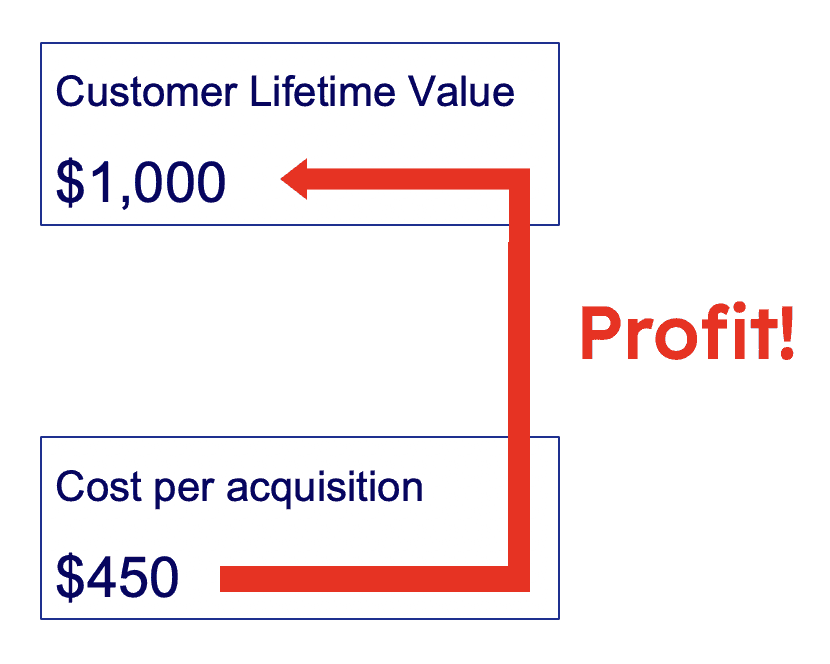
So workout your customer lifetime value and workout ways to improve it and of course, work out your cost per acquisition and ways to reduce it. As an extra tip, workout your acquisition cost by channel to give even deeper insights.
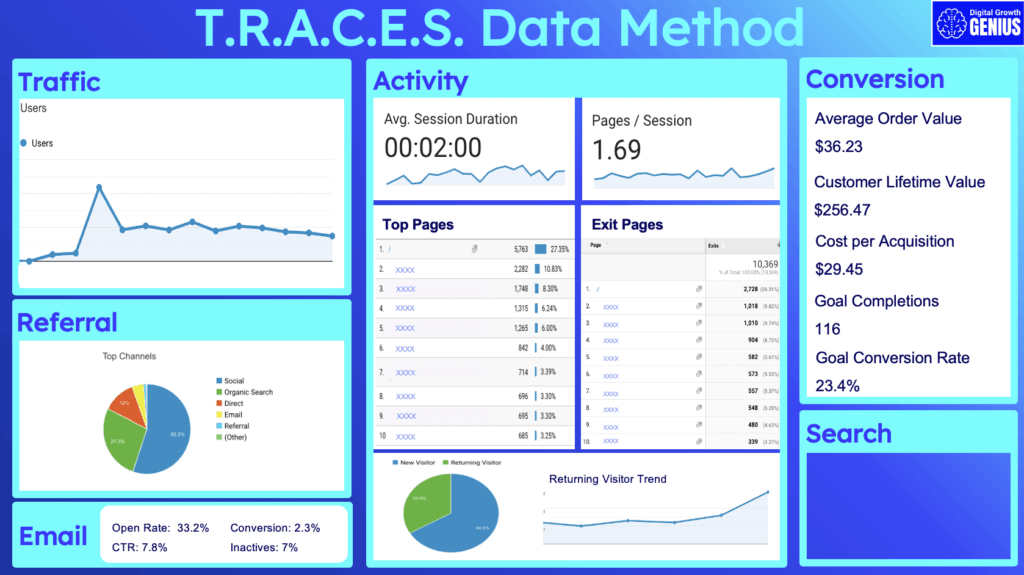
E = Email
The next step in the TRACES data method is E for Email.
I deep dive into email marketing in step 3 of this series but there are 4 metrics I watch like a hawk.
The first is Open rates. If your emails aren’t getting opened email marketing just isn’t going to work for you. Your open rate should be at least 20%. If it isn’t review your subject lines and test different variations to see what works.
The second metric is click through rate. Once you’ve got people opening your emails you need to monitor click through rates to make sure people are taking action. You should be driving more than a 2.5% click through rate. If not, review your content and offer and again, test to see what works.
The third metric is conversion. Now I recommend that 75% of your emails be value add emails without necessarily having a direct offer so make sure you are measuring the conversion of emails only with a direct offer. If your conversion percentage is low reconsider your offers and test, test, test.
The final metric is the percentage of inactive emails. These are email addresses that aren’t even opening your email. If this is growing consider whether your messaging is right or perhaps the source of those emails just wasn’t a great source.
S = Search
The final letter in my TRACES data method is S which stands for Search..
In step 5 of this series I explained how you can workout what key search terms to target so you can generate some free traffic from Google.
In this data step it’s all about monitoring where you rank for these key terms and some related metrics.
If you go to Ubersuggest and key in your domain name you will be presented with a really good summary of how your domain is going in the world of search.
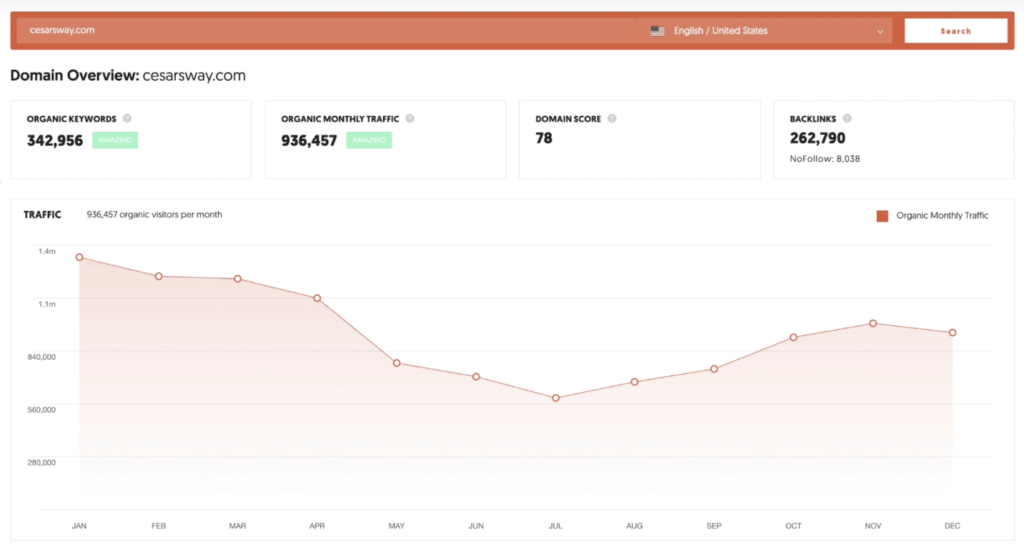
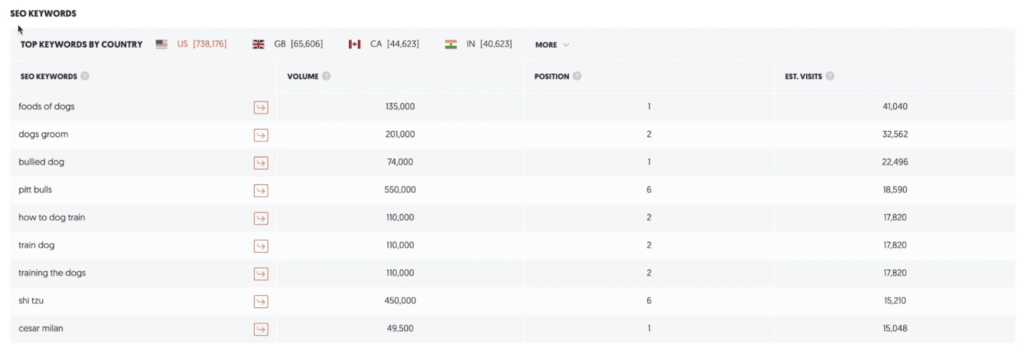
Now there is a lot of data here but focus on how many keywords you rank for and where those keywords are positioned in Google search display.
Then look at the all important number of backlinks and if you click on it you can see your progress over time.
Scroll down a little further and you will see the Top pages on your website generating google traffic and right down the bottom you’ll see the keywords that are generating this traffic.
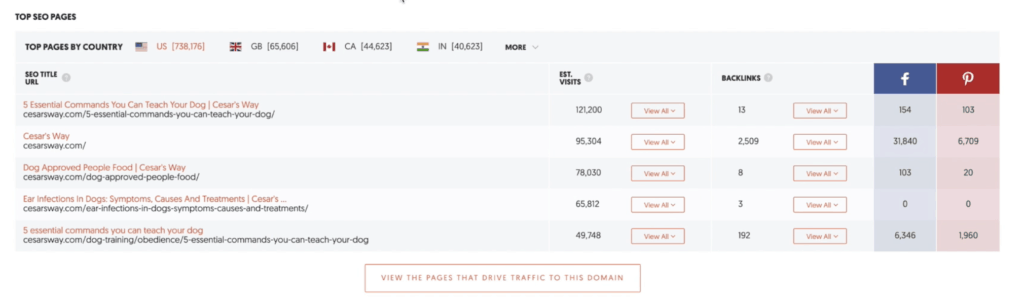
Now a hot tip is to focus on keywords that you rank for in the top 20. If you can focus on improving the pages that are relevant for that keyword you’ll get an even bigger bump in Google traffic and I’ll go into more detail on how to do this in a future episode.
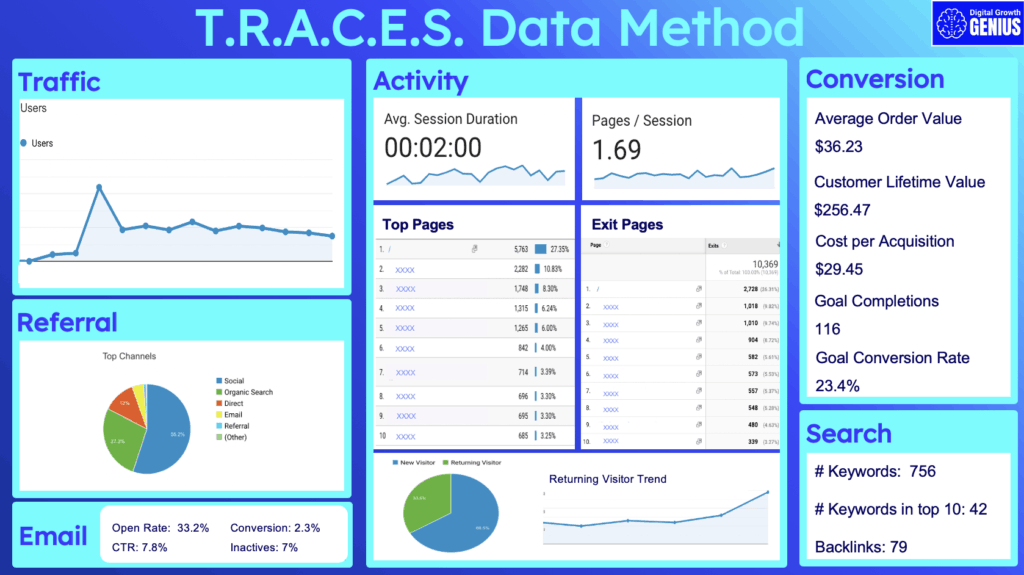
The TRACES Dashboard
So these Search metrics complete our top TRACES dashboard.
In addition to all the key metrics I have taken you through in this episode think through what other metrics might be relevant for your business.
For example, you might be targeting women so check out the demographics section in Google Analytics to see if you are successful and setup a metric to monitor this.
Once you have these additional metrics, add them to the TRACES dashboard so you keep a tight watch on them.
Wrap Up
So there you have my TRACES data method. This method will focus you on the key metrics you MUST be tracking in your business.
There are millions of metrics you can look at but start with these key metrics, try to understand the overall trends and, most importantly, WHY they are changing.
Tools like Google analytics and Google Search Console allow you to really deep dive and interrogate these metrics to gain a deep understanding of what is driving your performance.
If you do this you’ll quickly be able to workout what you need to focus on to grow your business with digital.
I have developed a downloadable summary of this guide for you to refer to as you build your own digital dashboard.
This article is step 6 in my series on how to turn your website into a Marketing machine in 6 steps. If you haven’t checked out the other articles follow the link.